North Carolina’s public animal shelters reported taking in 147,882 dogs and cats during calendar year 2025. They adopted out 71,705 of them, returned 15,338 to their owners, and euthanized 38,711. That is 26.2 percent of every dog and cat that came through a reporting shelter door, or roughly one in four.
Those totals come from a single state file, and that file is the only statewide animal shelter accounting North Carolina produces. It is also incomplete, preliminary, and harder to read than it should be. This post publishes the county-level numbers pulled directly from it, explains exactly what the file does and does not capture, and names the counties that did not file at all.
TL;DR: Across 63 reporting counties, NC shelters handled 147,882 dogs and cats in 2025 and euthanized 38,711 (26.2 percent). Cats died at a far higher rate than dogs, 29.6 percent against 22.8 percent. Euthanasia rates ranged from 2.2 percent in Stanly County to 62.0 percent in Johnston County. Reporting shelters spent $63.5 million, a median of $377.38 per animal, and spending did not predict outcomes. Thirty-six of North Carolina’s 100 counties are missing from the file entirely, including Wake, Forsyth, Iredell and Catawba. Meanwhile the state spay/neuter fund covered only about a third of eligible reimbursement requests in the first half of 2026. Sign the petition to fund prevention at the scale the intake numbers demand.
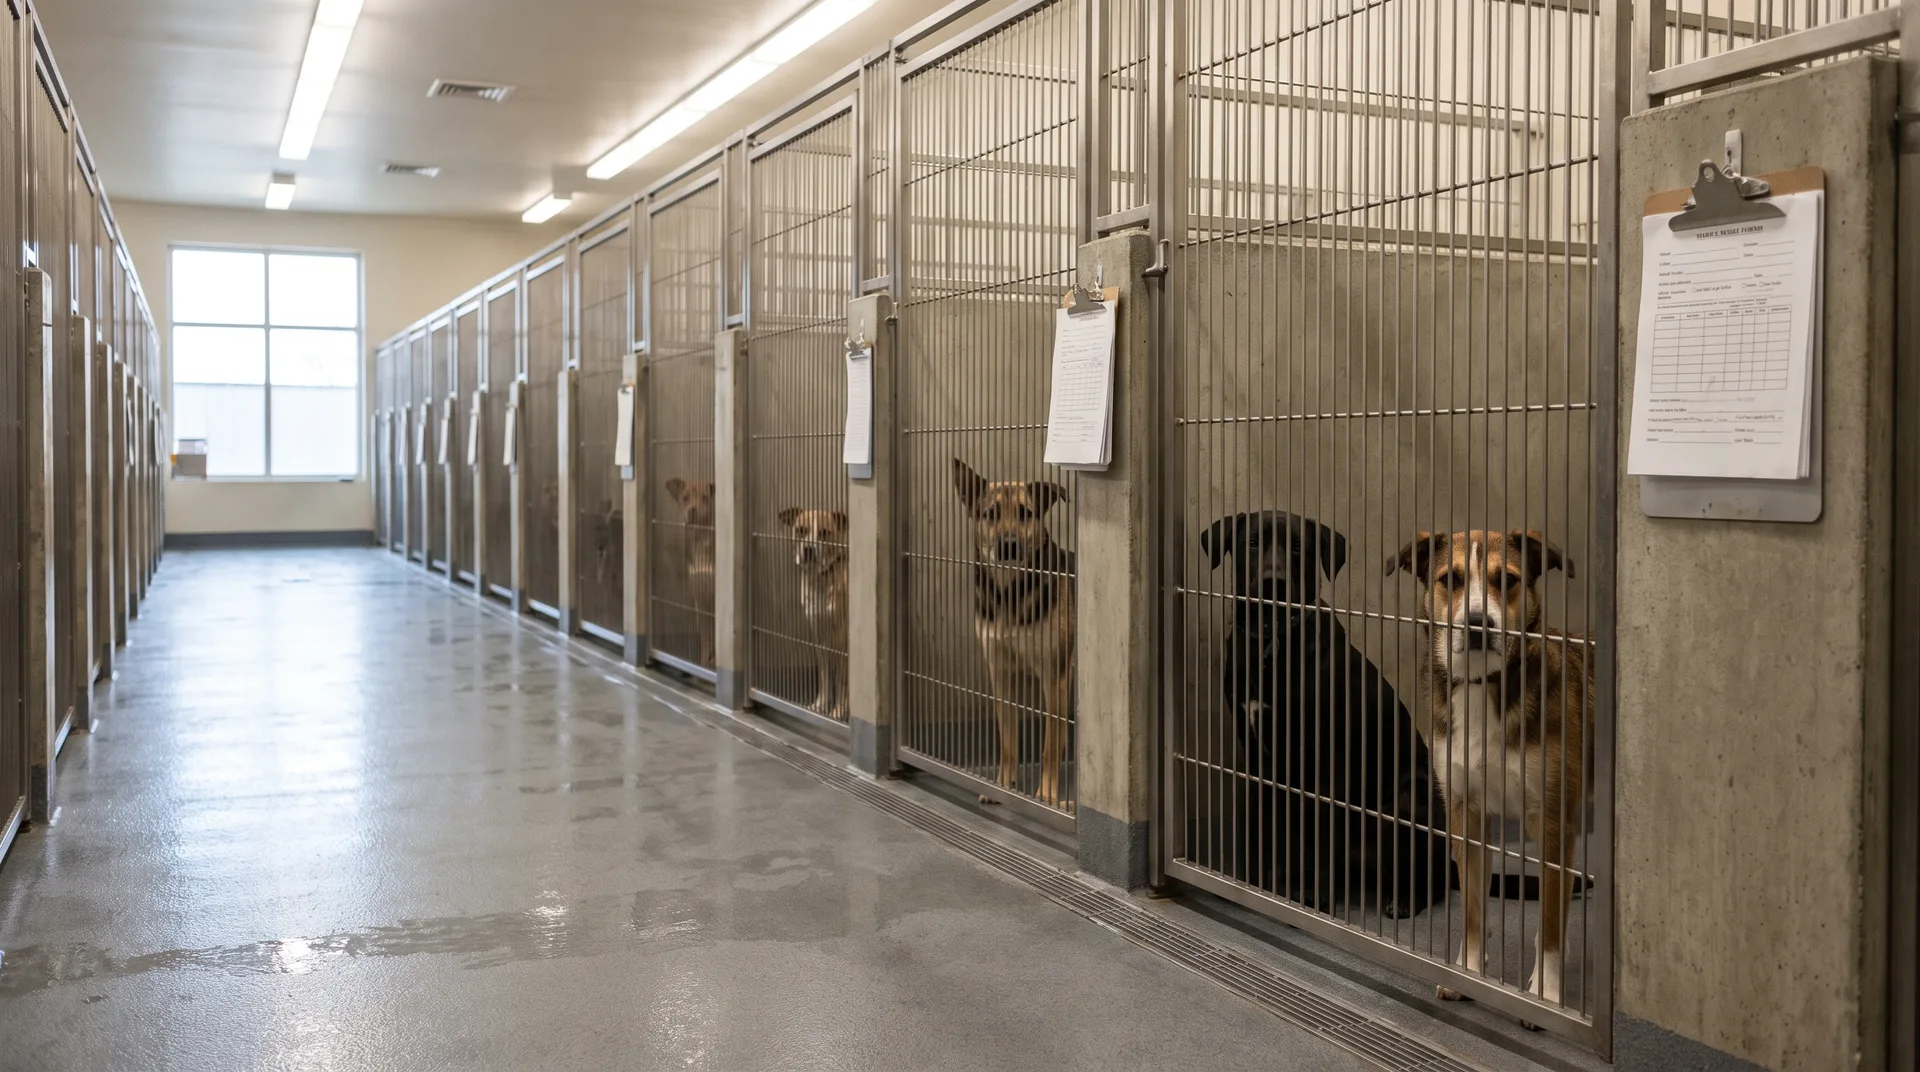
What North Carolina’s 2025 Shelter Numbers Actually Say
The North Carolina Department of Agriculture and Consumer Services collects an annual report from every county and city animal shelter that receives state or local funding. The 2025 calendar-year edition was posted on July 27, 2026, and as of this writing it still carries that same date and is still labeled preliminary. It covers 71 facilities across 64 counties, and 63 of those counties reported usable dog and cat numbers.
Two things about that scope are worth fixing in your head before you read a single number. The file is not a census of North Carolina animal sheltering. It is a census of the shelters that filed a form, which is a smaller and shifting group from one year to the next. And it counts far more than dogs and cats: shelters reported rabbits, goats, chickens, guinea pigs, horses, bats, raccoons, opossums and foxes, among dozens of other species. Wildlife intake in particular skews an untrained reading of the file badly, because animals like bats and raccoons are almost always euthanized for rabies testing, and including them inflates a county’s apparent kill rate for reasons that have nothing to do with pets.
Every figure in this report is therefore restricted to dogs and cats, aggregated from the individual facility lines rather than from any summary the state publishes. Where a county runs more than one reporting facility, and 71 facilities filed across 64 counties, the facilities are combined into a single county row.
Here is the whole state, as reported, in one table. Every figure below is a sum of the individual facility lines in the state file, not an estimate.
| 2025 calendar year, reporting counties | Dogs | Cats | Both | Share of intake |
|---|---|---|---|---|
| Intake | 74,302 | 73,580 | 147,882 | 100% |
| Adopted out | 34,329 | 37,376 | 71,705 | 48.5% |
| Returned to owner | 12,986 | 2,352 | 15,338 | 10.4% |
| Euthanized | 16,959 | 21,752 | 38,711 | 26.2% |
| Not broken out by the state form | 10,028 | 12,100 | 22,128 | 15.0% |
Read that last row carefully, because it is the single most important caveat in the entire dataset. The state form asks for four outcomes: intake, adopted out, returned to owner, and destroyed. It does not ask how many animals were transferred to a rescue partner, died in care, were reclaimed by a finder, or were still in the building on December 31. So 22,128 animals, 15 percent of everything that came in, simply do not appear in any outcome column.
Most of those 22,128 were almost certainly transferred to rescues and adopted somewhere else, which is a good outcome. But because the form does not capture it, nobody can compute a true live release rate for a North Carolina county from this file. Cherokee County illustrates the trap perfectly: it reports 1,645 intakes and only 43 euthanasias, a 2.6 percent euthanasia rate, but its four reported outcomes account for under half its intake. A naive live release calculation would make Cherokee look like one of the worst counties in the state when its euthanasia number is one of the best. The honest metric this file supports is the reported euthanasia share, and that is the metric used throughout this post.
Where These Numbers Come From, and What the Law Requires
The reporting requirement is statutory, not voluntary. G.S. 19A-65 requires every county or city animal shelter, every shelter operating under contract with a county or city, and every shelter otherwise receiving state or local funding to file an annual report with the Department of Agriculture and Consumer Services by March 1 of each year. The statute spells out exactly what has to be in it: numbers by species of animals received, adopted out, returned to owner and destroyed, plus the shelter’s total operating expenses and its cost per animal handled.
The statute also carries a penalty, and it is a real one. A city or county that does not timely file is not eligible to receive spay/neuter reimbursement payments under G.S. 19A-64 during the calendar year in which the report was due. The Department’s December 30, 2025 memorandum to shelters restates it plainly: submitting a 2025 annual shelter report is required in order to request reimbursements during 2026. Skipping the form costs a county money it could have spent sterilizing pets belonging to low-income residents.
| What the state form captures | What it does not |
|---|---|
| Intake, by species | Transfers out to rescue partners |
| Adopted out, by species | Animals that died in care |
| Returned to owner, by species | Animals still in the shelter at year end |
| Euthanized, by species | Any distinction between medical and space euthanasia |
| Total operating expenses | What the money was spent on |
| Cost per animal handled | Any common definition of that cost |
| Wildlife and livestock species, if the shelter adds them | Length of stay, return-to-field, or owner-surrender versus stray split |
The gaps matter because they change what advocates can argue. Without a medical-versus-space breakdown, a county can attribute a 50 percent euthanasia rate to sick and injured animals and no one can check. Without length of stay, nobody can show that a county’s adoption program is slow rather than absent. Without a transfer column, a rural county that saves animals by shipping them to a metro rescue gets no statistical credit for it. Every one of those omissions is a design choice in a form that has not meaningfully changed in years, and each one could be fixed with a few extra boxes.
There is a smaller but more irritating problem too. The Excel version of the 2025 file loses the species label on 33 rows, covering Durham, Edgecombe, Franklin and Gaston counties. Anyone who opens the spreadsheet and sums the rows labeled “Dog” will silently undercount statewide dog intake by 5,171 animals and cat intake by 4,248. The PDF version of the same file has the labels intact. Every figure in this post was computed from the PDF for exactly that reason.
Thirty-Six Counties Are Missing From the File
Sixty-four of North Carolina’s 100 counties appear in the 2025 file. Thirty-six do not, and the absences are not confined to tiny rural counties with no shelter. Wake County, home to Raleigh and the Triangle, is not in the file. Neither is Forsyth, Iredell, Catawba, Henderson, Cleveland, or Wayne.
| Counties with no 2025 data in the state file (36 of 100) |
|---|
| Alleghany, Anson, Bertie, Camden, Carteret, Catawba, Chatham, Cleveland, Columbus, Dare, Forsyth, Gates, Graham, Granville, Greene, Halifax, Henderson, Hertford, Hoke, Hyde, Iredell, Jones, Lenoir, Macon, Madison, McDowell, Pamlico, Perquimans, Polk, Rutherford, Swain, Wake, Warren, Washington, Watauga, Wayne |
That caveat is important and it cuts both ways. The 2024 edition of this same report was still being revised on November 24, 2025, nearly a year after the reporting year closed and almost nine months after the March 1 deadline. Fifteen counties that reported dog and cat numbers in the final 2024 file are missing from the current 2025 version, which strongly suggests the 2025 file will keep growing. So some of the 36 names above are late, not absent.
But the practical effect on anyone trying to understand North Carolina today is the same either way. Fourteen months after calendar year 2025 ended, there is no public number for how many animals entered Wake County’s shelter or what happened to them. The statewide totals in this post are therefore a floor. When the missing counties land, intake and euthanasia will both go up, and the percentages may shift in either direction. Anyone citing a North Carolina statewide shelter figure should name the file version and the county count, which is why every table here does.
It is also worth being precise about what non-reporting means legally. G.S. 19A-65 binds shelters in receipt of state or local funding. A county with no county-run or county-contracted shelter, of which North Carolina has several, may have nothing to file. The counties in the list with large municipal shelter operations are a different matter, and their residents are entitled to ask why the form is late.
The Counties With the Highest Euthanasia Rates
Statewide averages hide the thing that actually matters, which is that an animal’s odds in a North Carolina shelter depend enormously on which county line it was picked up inside. Below are the eight highest reported euthanasia shares among counties that handled at least 750 dogs and cats, a floor that keeps very small operations from dominating a percentage ranking.
Johnston County sits at 62.0 percent. Caldwell is a fraction behind at 60.9 percent. Several of the counties on that chart are neighbors. Surry, Stokes, Wilkes and Caldwell form a contiguous northwestern chain where every reported euthanasia share falls between 53 and 61 percent, and Davidson, Randolph and Davie sit together just to the south at 57, 48 and 31 percent. Geography is not destiny here, though. Rowan County is in the same part of the state, handled more animals than any of them at 5,456, and reported a 5.6 percent euthanasia share.
Two of the counties in that block deserve a closer look because their numbers are unusual in a way percentages alone will not show. Surry County reported 3,269 intakes and only 310 adoptions, while returning 1,178 animals to owners, an extraordinary return rate of 36 percent that is more than three times the statewide figure. Davidson County reported 3,880 intakes and 395 adoptions, roughly one adoption for every ten animals received. When a shelter’s adoption column is that thin, the euthanasia column has to absorb the difference, and it does.
The Counties With the Lowest Euthanasia Rates
The other end of the range is the more useful half of this data, because it establishes what is achievable inside North Carolina’s actual constraints, with North Carolina budgets, in North Carolina’s actual intake environment. These are not aspirational out-of-state benchmarks. They are counties a two-hour drive from the worst performers.
| County | Dogs and cats handled | Euthanized | Reported euthanasia share |
|---|---|---|---|
| Stanly | 811 | 18 | 2.2% |
| Cherokee | 1,645 | 43 | 2.6% |
| Rowan | 5,456 | 307 | 5.6% |
| Lincoln | 2,107 | 131 | 6.2% |
| Orange | 3,108 | 221 | 7.1% |
| Alamance | 6,288 | 512 | 8.1% |
| Transylvania | 1,031 | 90 | 8.7% |
| Haywood | 1,197 | 105 | 8.8% |
| Buncombe | 3,181 | 309 | 9.7% |
| Gaston | 2,312 | 231 | 10.0% |
Two entries on that list are worth singling out. Alamance County ran the second-largest intake in the whole file, 6,288 dogs and cats through Burlington Animal Services, and adopted out 5,335 of them. That is an 84.8 percent adoption share on high volume, and it is the strongest combination of scale and outcome anywhere in the 2025 data. Rowan County handled 5,456 animals and adopted out 3,893 at a 5.6 percent euthanasia share.
Both counties are ordinary North Carolina counties with ordinary North Carolina budgets. Neither is wealthy, coastal, or unusually small. What separates them from Johnston and Davidson is not their tax base, it is how their shelters are run: active adoption programs, real foster networks, rescue partnerships that move animals out, and sterilization on the way out the door so the same litter does not come back next spring. Our guide to what no-kill actually means in North Carolina walks through the specific programs that produce these numbers.
Cats Are Dying at a Much Higher Rate Than Dogs
Dogs and cats entered North Carolina shelters in almost identical numbers in 2025: 74,302 dogs and 73,580 cats. What happened next was not similar at all. Shelters euthanized 22.8 percent of dogs and 29.6 percent of cats. And the reason is visible in one column: 12,986 dogs went home to their owners, against just 2,352 cats. Dogs get reclaimed, cats do not.
That gap is the mechanical signature of free-roaming and unowned cats. A loose dog in a North Carolina neighborhood is usually somebody’s dog and somebody comes looking. A loose cat is frequently a community cat with no owner to call, so once it enters a shelter its only exits are adoption, rescue transfer, or euthanasia. In some counties the resulting gap is enormous.
| County | Cat euthanasia share | Dog euthanasia share | Gap | Cats handled |
|---|---|---|---|---|
| Surry | 74.7% | 29.6% | +45.1 pts | 1,761 |
| Ashe | 57.5% | 16.3% | +41.2 pts | 550 |
| Randolph | 66.3% | 28.0% | +38.3 pts | 1,868 |
| Johnston | 79.8% | 43.2% | +36.5 pts | 1,778 |
| Wilkes | 66.7% | 39.0% | +27.6 pts | 1,987 |
| Chowan | 56.1% | 29.5% | +26.6 pts | 877 |
| Stokes | 63.7% | 37.8% | +25.9 pts | 995 |
| Davidson | 67.2% | 44.2% | +23.0 pts | 2,098 |
In Johnston County, four out of every five cats that entered the shelter in 2025 were euthanized. In Surry County it was three out of four. These are not counties with unusual cats. They are counties without a working alternative to intake for unowned cats, which is precisely what a trap-neuter-return program provides. North Carolina’s state spay/neuter fund reimburses procedures for dogs and cats owned by low-income people, and community cats do not qualify, which means the single most effective intervention for the numbers in that table has no state funding stream at all. We lay out the arithmetic in detail in our analysis of what a state-funded TNR program would cost and save.
What Sheltering Costs North Carolina Taxpayers
The 2025 file is the first edition rich enough to answer a question advocates get asked constantly by county commissioners: what does this actually cost? Fifty-seven facilities reported total operating expenses, and they add up to $63,518,877. Fifty-six reported a cost per animal handled, with a median of $377.38.
Both numbers should be handled with care. The statute requires a cost per animal figure but does not define how to compute it, and the reported range runs from $30.00 to $1,600.00, a spread no real operational difference can explain. Some facilities clearly divided a full departmental budget, including animal control field operations, by the animals housed. Others appear to have counted only shelter costs, or only a municipal contribution. The median is the honest summary statistic here, and even that is a median of inconsistently defined values.

What the cost column does reliably show is that spending does not buy outcomes on its own. Davidson County reported $217.16 per animal and a 56.6 percent euthanasia share. Rowan County, in the same region and handling more animals, reported $242.61 per animal and a 5.6 percent share. Johnston County reported $343.85 per animal, above the state median, with the worst euthanasia rate in the file at 62.0 percent. Alamance County reported $418.00 per animal with an 8.1 percent rate.
Those four counties sit within about $200 per animal of one another and produce results that differ by a factor of ten. Money is necessary, and rural shelters are genuinely underfunded, but the 2025 data does not support the claim that a county’s euthanasia rate is simply a function of its budget. Program design, staffing choices, adoption hours, foster recruitment and rescue partnerships explain more of the variance than dollars per animal do.
There is a larger fiscal point buried in that $63.5 million. It is the cost of managing a surplus after the animals exist. Every dollar in it is spent downstream of the problem. The upstream intervention, sterilization, is funded at a scale that is not remotely comparable, as the next section shows.
The Prevention Money Runs Out Every Single Quarter
North Carolina has a state spay/neuter reimbursement program, established under Article 5 of Chapter 19A. Counties and cities apply quarterly for reimbursement of the direct cost of sterilizing dogs and cats owned by low-income residents. It is funded by a legislative appropriation plus the proceeds of the “I Care” Animal Lovers license plate, which sends $20 per plate to the fund.
According to the Department’s December 30, 2025 memorandum, the program received $250,000 in appropriated funds for calendar year 2025, transferred in quarterly installments, plus $122,228.33 from license plate sales across the four 2025 quarters. That is roughly $372,000 to reduce future shelter intake in a state whose reporting shelters spent $63.5 million handling the animals that already arrived.
The quarterly reimbursement reports show what happens to a fund that small when counties actually use it.
| NC Spay/Neuter Program, 2026 | 1st quarter | 2nd quarter | First half total |
|---|---|---|---|
| Funds available | $79,913.85 | $76,832.00 | $156,745.85 |
| Amount eligible for reimbursement | $210,230.92 | $230,256.93 | $440,487.85 |
| Share of eligible requests funded | 38.0% | 33.4% | 35.6% |
| Procedures reimbursed | 1,777 | 1,865 | 3,642 |
| Participating counties and municipalities | 27 | 28 | n/a |
In the first six months of 2026, North Carolina counties documented $440,487.85 in eligible low-income spay/neuter reimbursements and the state was able to pay $156,745.85 of it. Roughly two dollars in every three of demonstrated, rule-compliant demand went unfunded. When requests exceed the account, G.S. 19A-64 splits what remains fifty-fifty between the state’s most economically distressed tier one counties and everyone else, then prorates within each group by sterilizations per thousand residents. It is a careful rationing formula for a fund that is too small to do the job.
Note the participation figure too. Only 27 to 28 counties and municipalities drew on the fund at all, in a state with 100 counties. Some of that is capacity, since a county needs a participating veterinarian and staff time to process claims. Some of it is the G.S. 19A-65 penalty doing its work: a county that missed the shelter report deadline is locked out of reimbursement for the year. Our county-by-county low-cost spay and neuter directory lists what is actually available to residents right now, and our look at states that got it right covers how New Hampshire funds a comparable program at a scale that measurably cut its shelter intake.
Did 2025 Get Better or Worse Than 2024?
This is the question the raw totals cannot answer, because the two files cover different sets of counties. The 2024 report ended up with 69 counties reporting dog and cat data; the current 2025 file has 63. Comparing 153,692 against 147,882 would just be comparing two different samples of North Carolina.
The fix is to compare only the 54 counties that reported dog and cat numbers in both years. That is a genuine like-for-like read on the same shelters, twelve months apart.
| Same 54 counties, both years | 2024 | 2025 | Change |
|---|---|---|---|
| Dogs and cats taken in | 132,058 | 137,537 | +5,479 (+4.1%) |
| Adopted out | 69,640 | 67,794 | -1,846 (-2.7%) |
| Adoption share of intake | 52.7% | 49.3% | -3.4 pts |
| Returned to owner | 12,888 | 14,582 | +1,694 (+13.1%) |
| Euthanized | 34,828 | 36,151 | +1,323 (+3.8%) |
| Euthanasia share of intake | 26.4% | 26.3% | -0.1 pts |
The headline is that the percentage held almost perfectly flat while the absolute numbers got worse. Intake rose 4.1 percent. Euthanasia rose 3.8 percent, which is 1,323 more animals killed in the same 54 counties. And adoptions fell, both in share and in raw count, which is the most troubling line in the table: the same shelters took in more animals and placed fewer of them.
A flat euthanasia percentage in a year of rising intake is not progress. It means the system absorbed 5,479 additional animals without improving a single outcome, and it did so with 1,846 fewer adoptions to work with. Our post on how many animals are euthanized in NC each year sets North Carolina’s rate against the national figures from Shelter Animals Count and Best Friends, and the distance is not small.
How to Read Your Own County’s Numbers
The county table in the next section is meant to be used, not just read. If you are about to email a county commissioner, speak at a public comment period, or write to your legislator, a handful of comparisons will do more work than any general appeal.
Start with the euthanasia share and put it next to the statewide 26.2 percent. That single comparison frames everything else, and it is hard for anyone to wave away because it comes from the county’s own filing. Then look at the adoption count against intake. A county taking in 3,000 animals and adopting out 400 has an adoption program problem, not an overpopulation excuse, and the counties in the low table prove that placement volume is achievable.
Next, compare the cat euthanasia share with the dog share. If cats are dying at double the dog rate, the county needs a community cat strategy, and our guide to starting a TNR program is a concrete thing to hand someone. Then check whether your county appears in the missing-counties list above. If it does, the first ask is not a program, it is the form itself, because filing is the precondition for the state reimbursement money.
Finally, keep the caveats in your pocket, because someone will raise them and you want to be the person who raised them first. The file is preliminary. It has no transfer column, so a low adoption number does not automatically mean animals died. The cost per animal figures are not computed consistently between counties. Being straight about all three makes the euthanasia comparison land harder, not softer. When you are ready, here is how to contact your NC representative with the numbers in hand.
What Would Actually Change These Numbers
Nothing in the 2025 data suggests North Carolina’s shelters are failing through indifference. The counties with the worst rates are largely rural, thinly staffed, and taking in more animals per capita than the metros. What the data does show is a system funded almost entirely at the wrong end of the pipeline: $63.5 million to manage animals after they exist, and about $372,000 to prevent them.
That ratio is the clearest single fact in the 2025 file. Put the two figures side by side and the state’s priorities stop being a matter of interpretation.
Three changes are visible directly in these numbers. First, fund the spay/neuter account at the level of demonstrated demand. Counties documented $440,487.85 in eligible requests in six months and received $156,745.85. The unmet portion is not speculative need, it is paperwork the state already validated and could not pay. Second, make community cats eligible. Cats were euthanized at 29.6 percent against 22.8 percent for dogs, and in the eight counties with the widest gap the cat rate ran between 56 and 80 percent. The intervention that addresses that is trap-neuter-return, and it currently sits outside the only state funding stream that exists.
Third, fix the form. Adding a transfer-out column, a died-in-care column, an in-custody-at-year-end column, and a split between medical and space euthanasia would cost the state nothing and would let any resident evaluate their own county honestly. As it stands, the file cannot distinguish a shelter that saves animals by transferring them from one that simply fails to place them, which protects underperforming counties from scrutiny and denies credit to counties doing the work.
The counties at the top of the low table already demonstrate what is possible. Alamance placed 5,335 of 6,288 animals. Rowan euthanized 307 of 5,456. Those outcomes were produced in North Carolina, in 2025, on county budgets, which removes the last excuse available to any commissioner who claims the numbers cannot move. The full statewide picture, and what it costs everyone, is laid out in our guide to North Carolina’s pet overpopulation crisis.
The Full County Table: All 63 Reporting Counties
Every county that reported dog or cat data in the 2025 file, alphabetically. Intake, adoptions, returns to owner and euthanasia are the four outcome columns the state form collects. The percentage is euthanasia as a share of that county’s reported intake. Because of the missing transfer column, these four outcomes will not sum to intake for most counties.
| County | Intake | Adopted | To owner | Euthanized | Euth. share |
|---|---|---|---|---|---|
| Alamance | 6,288 | 5,335 | 304 | 512 | 8.1% |
| Alexander | 766 | 338 | 124 | 277 | 36.2% |
| Ashe | 1,048 | 511 | 137 | 397 | 37.9% |
| Avery | 498 | 469 | 10 | 34 | 6.8% |
| Beaufort | 1,159 | 654 | 80 | 275 | 23.7% |
| Bladen | 1,660 | 1,352 | 115 | 179 | 10.8% |
| Brunswick | 4,492 | 1,876 | 480 | 1,052 | 23.4% |
| Buncombe | 3,181 | 2,278 | 784 | 309 | 9.7% |
| Burke | 2,117 | 1,696 | 150 | 287 | 13.6% |
| Cabarrus | 2,966 | 732 | 750 | 539 | 18.2% |
| Caldwell | 2,155 | 503 | 171 | 1,313 | 60.9% |
| Caswell | 922 | 372 | 65 | 185 | 20.1% |
| Cherokee | 1,645 | 639 | 62 | 43 | 2.6% |
| Chowan | 1,368 | 444 | 95 | 637 | 46.6% |
| Craven | 4,522 | 1,052 | 284 | 775 | 17.1% |
| Cumberland | 7,683 | 3,317 | 513 | 1,671 | 21.7% |
| Currituck | 1,303 | 1,005 | 148 | 167 | 12.8% |
| Davidson | 3,880 | 395 | 313 | 2,196 | 56.6% |
| Davie | 864 | 467 | 123 | 271 | 31.4% |
| Duplin | 2,531 | 577 | 142 | 754 | 29.8% |
| Durham | 4,584 | 2,395 | 461 | 1,534 | 33.5% |
| Edgecombe | 740 | 483 | 56 | 151 | 20.4% |
| Franklin | 1,783 | 438 | 145 | 363 | 20.4% |
| Gaston | 2,312 | 1,716 | 236 | 231 | 10.0% |
| Guilford | 6,652 | 4,584 | 801 | 1,123 | 16.9% |
| Harnett | 3,360 | 1,036 | 151 | 1,485 | 44.2% |
| Haywood | 1,197 | 971 | 151 | 105 | 8.8% |
| Jackson | 622 | 280 | 70 | 70 | 11.3% |
| Johnston | 3,459 | 977 | 333 | 2,145 | 62.0% |
| Lee | 1,431 | 1,069 | 155 | 207 | 14.5% |
| Lincoln | 2,107 | 1,770 | 244 | 131 | 6.2% |
| Martin | 226 | 15 | 27 | 187 | 82.7% |
| Mecklenburg | 9,263 | 5,099 | 1,242 | 1,289 | 13.9% |
| Mitchell | 1,122 | 418 | 58 | 214 | 19.1% |
| Montgomery | 921 | 476 | 73 | 196 | 21.3% |
| Moore | 2,004 | 352 | 183 | 1,031 | 51.4% |
| Nash | 1,647 | 995 | 153 | 481 | 29.2% |
| New Hanover | 388 | 390 | 3 | 1 | 0.3% |
| Northampton | 708 | 538 | 81 | 85 | 12.0% |
| Onslow | 3,263 | 1,765 | 512 | 455 | 13.9% |
| Orange | 3,108 | 2,481 | 273 | 221 | 7.1% |
| Pasquotank | 50 | 0 | 5 | 5 | 10.0% |
| Pender | 3,721 | 2,273 | 246 | 1,022 | 27.5% |
| Person | 1,218 | 317 | 160 | 518 | 42.5% |
| Pitt | 2,427 | 1,290 | 228 | 518 | 21.3% |
| Randolph | 3,619 | 1,259 | 411 | 1,729 | 47.8% |
| Richmond | 599 | 443 | 56 | 44 | 7.3% |
| Robeson | 2,327 | 359 | 120 | 659 | 28.3% |
| Rockingham | 4,253 | 1,627 | 317 | 1,832 | 43.1% |
| Rowan | 5,456 | 3,893 | 314 | 307 | 5.6% |
| Sampson | 2,093 | 899 | 110 | 1,040 | 49.7% |
| Scotland | 887 | 545 | 44 | 280 | 31.6% |
| Stanly | 811 | 696 | 59 | 18 | 2.2% |
| Stokes | 1,698 | 676 | 112 | 900 | 53.0% |
| Surry | 3,269 | 310 | 1,178 | 1,761 | 53.9% |
| Transylvania | 1,031 | 403 | 538 | 90 | 8.7% |
| Tyrrell | 74 | 58 | 8 | 8 | 10.8% |
| Union | 3,506 | 1,205 | 285 | 1,099 | 31.3% |
| Vance | 2,026 | 348 | 157 | 601 | 29.7% |
| Wilkes | 3,788 | 1,431 | 318 | 2,028 | 53.5% |
| Wilson | 1,126 | 375 | 238 | 378 | 33.6% |
| Yadkin | 851 | 200 | 74 | 164 | 19.3% |
| Yancey | 1,107 | 838 | 102 | 132 | 11.9% |
| All 63 reporting counties | 147,882 | 71,705 | 15,338 | 38,711 | 26.2% |
Clay County appears in the file but is not in this table. Its single reporting facility filed 342 animals with no species label at all, so its numbers cannot be attributed to dogs or cats. G.S. 19A-65 requires the counts to be reported by species, which makes that particular blank a small compliance gap rather than a rounding detail.
Frequently Asked Questions
Sources
- NC Department of Agriculture and Consumer Services, Spay/Neuter and Animal Shelter Reports. All county figures in this post were computed from the 2025 CY Public Animal Shelter Report PDF, file as of 7/27/2026, and cross-checked against the 2024 CY report, file as of 11/24/2025.
- N.C. Gen. Stat. § 19A-65, Annual Report Required From Every Animal Shelter in Receipt of State or Local Funding.
- N.C. Gen. Stat. § 19A-64, Distributions to counties and cities from the Spay/Neuter Account.
- NC Department of Agriculture and Consumer Services, Memorandum to Animal Shelters in Receipt of State/Local Funds, December 30, 2025 (reporting deadline, 2025 appropriated and license plate funding, 2026 procedure caps). Available from the shelter reports page as “Memo to Counties.”
- NC Department of Agriculture and Consumer Services, 2026 1st and 2nd Quarter Spay/Neuter Fund Reimbursement reports.
- NC Spay/Neuter Program, program scope and “I Care” Animal Lovers license plate funding.
Methodology note: figures were aggregated from the individual facility lines in the NC DACS PDF using a text extraction of the published file, combining multiple facilities within a county. The Excel edition of the 2025 report omits the species label on 33 rows across Durham, Edgecombe, Franklin and Gaston counties; summing only the labeled rows understates statewide dog intake by 5,171 and cat intake by 4,248, so the PDF was used as the authoritative source. Clay County’s single facility reported 342 animals with no species label and is excluded from species totals.
Help us end animal overpopulation in NC.
NC ranks 2nd in the nation for shelter euthanasia. Together, we can change that through spay/neuter services and legislative reform.